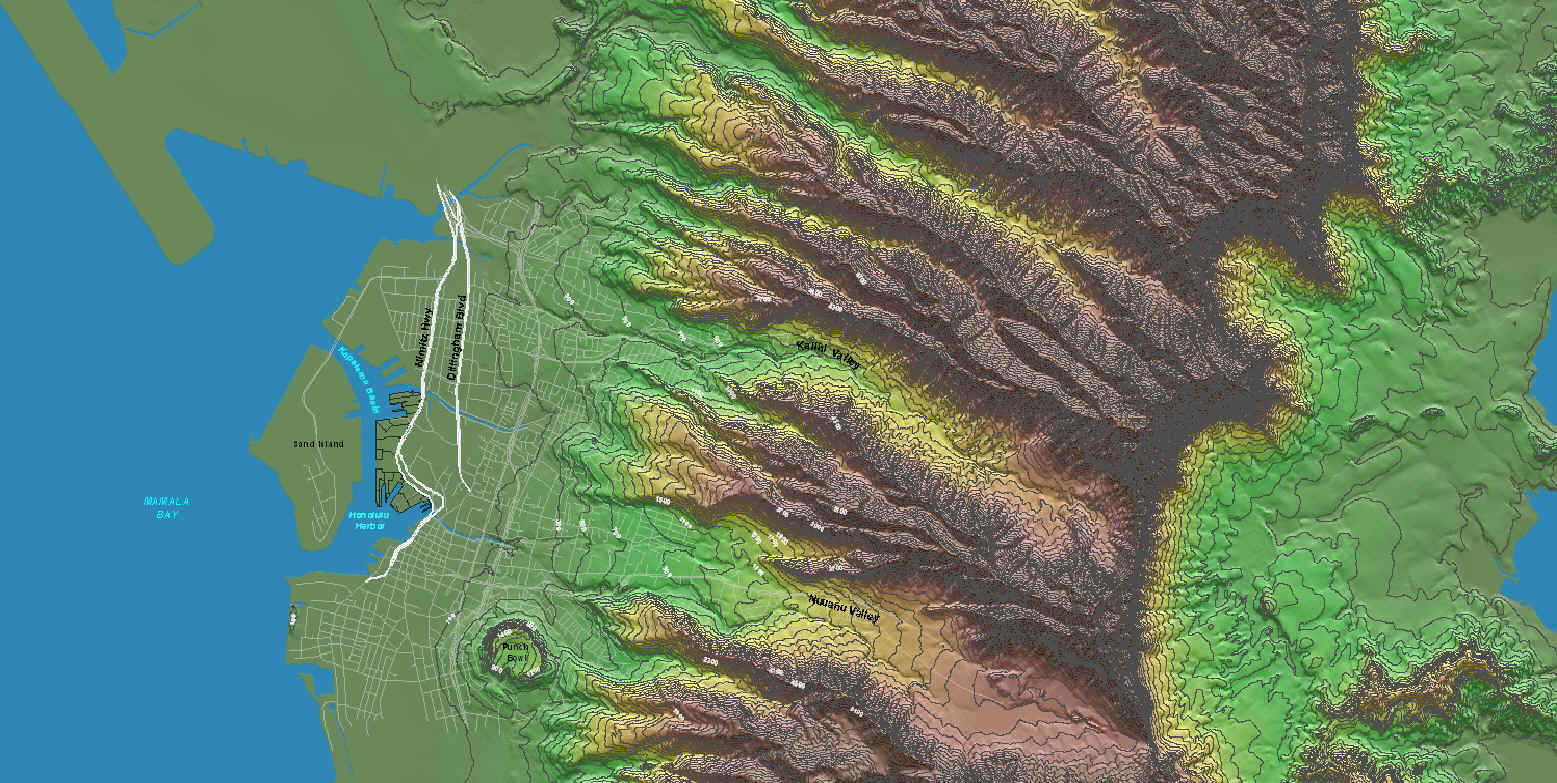
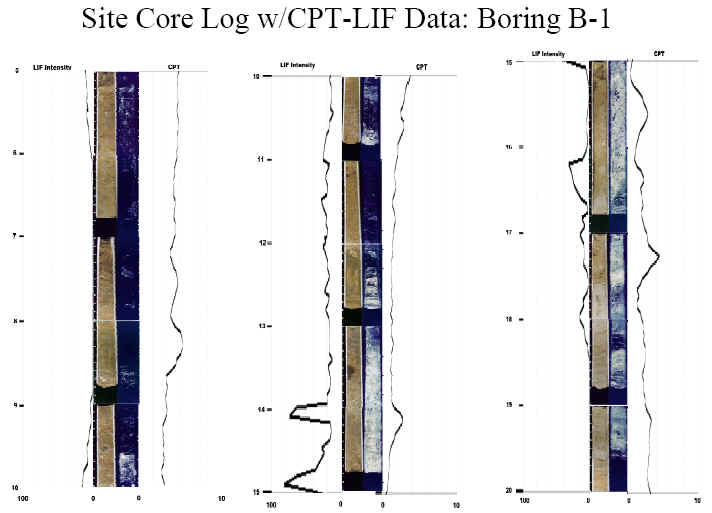
As anyone working in this field recognizes, we are a science steeped in data and mapping of that information or associated evaluations/models. Maximizing the use of existing data is one of the many outcomes of the skills here at AVI. From complex geostatistical renderings to simple and effective data presentations, our work products are hard to beat.
This facet of our work, as much as any other, is multidisciplinary. Understanding and handling the original data/information is a key piece. Knowing how to use and link different computer techniques is another. Finding the artistic component that makes the map or data presentation compelling is yet another. Combining art and scientific rigor produces some very powerful results.
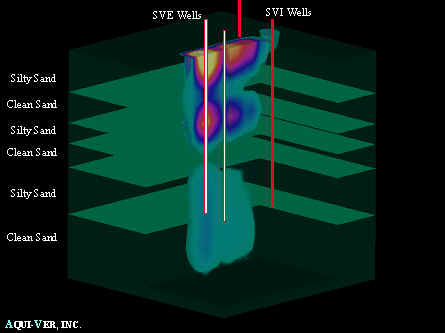
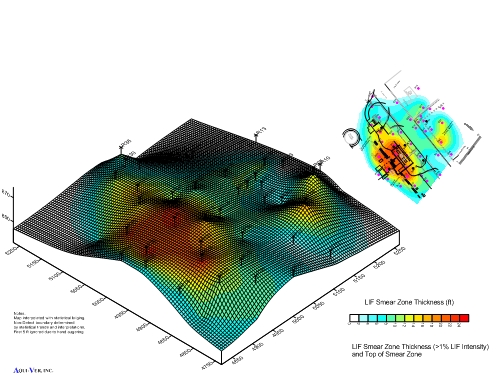
Finally, the world is 3-dimensional. Renderings of information, modeling, and other features also need to take that form to be informative. Whether it is a pseudo 3-D rendering like the image below, or a true rotational view of information, we have the experience and data handling skills to make those pictures tell a story.
A very few examples of data presentation are provided on this page. To find out more, or see more examples directed toward specific technical matter, please contact AVI.